



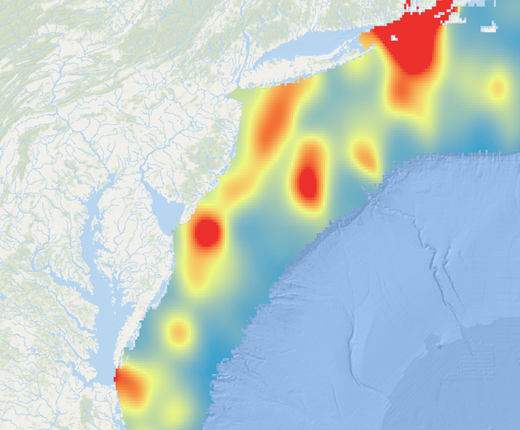
New sliders showing the seasonal abundance of ichthyoplankton for eight fish species and monthly concentrations of chlorophyll-a are now available in the Portal’s Marine Life theme.
Together with a collection of zooplankton products released in 2025, the data represent the base of marine food webs and are important factors when considering suitable habitat for megafauna like fish, seabirds, and marine mammals. The data from which the layers on the Portal are derived may also serve as inputs to species distribution models to predict density or abundance of higher trophic levels throughout the year.
Phytoplankton
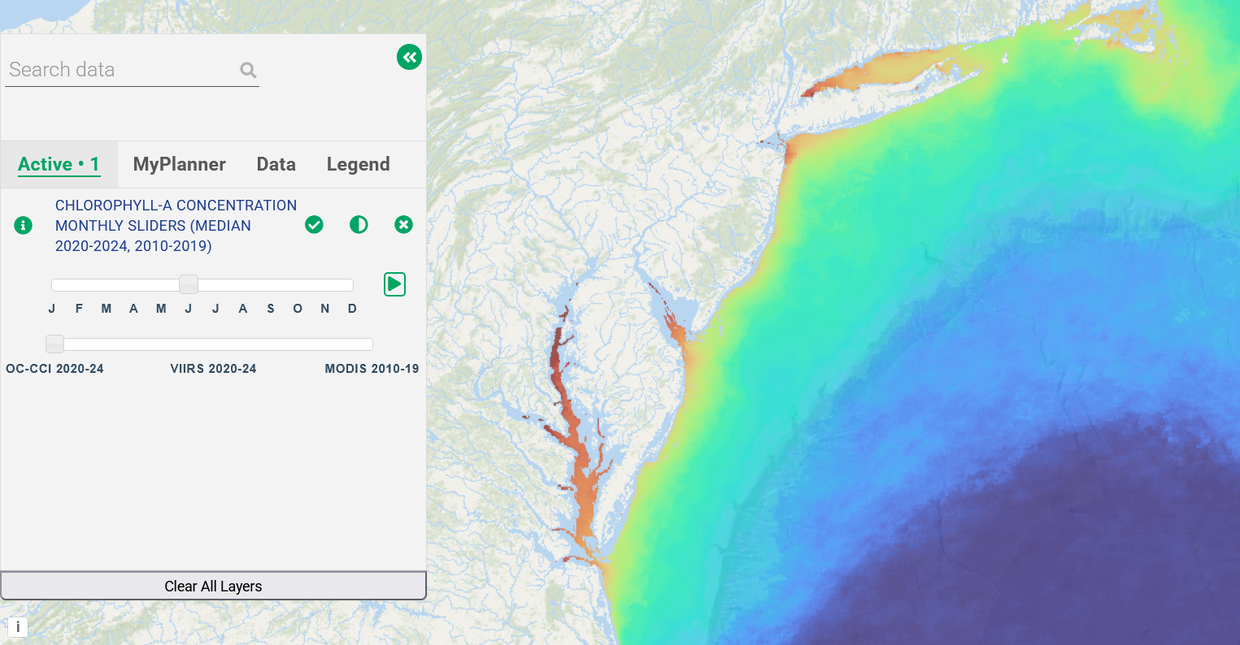
For these layers, surface chlorophyll-a (as measured via satellite) serves as a proxy to visualize phytoplankton abundance. These data products were developed by the Marine-life Data & Analysis Team (MDAT) and build off the methods used to develop data products previously representing chlorophyll-a from the Moderate-resolution Imaging Spectro-radiometer (MODIS) sensor onboard the NASA Aqua satellite from 2003-2015 (now archived).
The layers depict monthly median surface chlorophyll-a for the last decade (2010-2019) and as many years as were available this decade (2020-2024). The RWSC Habitat & Ecosystem Subcommittee provided input on the satellite sensors/datasets most useful over these time windows, for our geography, and for the desired resolution. They informed the production of the following datasets:
- Median Chlorophyll-a MODIS (2010-2019) – to match the sensor used in Portal products previously
- Median Chlorophyll-a VIIRS (2020-2024) – to represent the most recent decade since MODIS is no longer consistently collecting data in our region
- Median Chlorophyll-a Composite (2020-2024) - to represent the most recent decade since MODIS is no longer consistently collecting data in our region. This composite data product was identified by Habitat and Ecosystem Subcommittee members as a useful resource that employs multiple algorithms to synthesize chlorophyll-a data from several different sensors at different temporal scales.
With the Chlorophyll-A Concentration Monthly Sliders (Median 2020-24, 2010-19) activated, you can click the Active tab and use the toggle to choose any of the three datasets. You may also manually toggle through the months or click the play button to automatically animate the maps in Marine Planner.
Work is underway to publish additional chlorophyll-a products on the Portal in collaboration with the Mid-Atlantic Coastal Acidification Network this summer. These data will represent the seasonal cycle for chlorophyll-a collected at specified sites in the Mid-Atlantic Bight, Barnegat Bay, Chesapeake Bay, Delaware Bay, and offshore New Jersey.
Ichthyoplankton
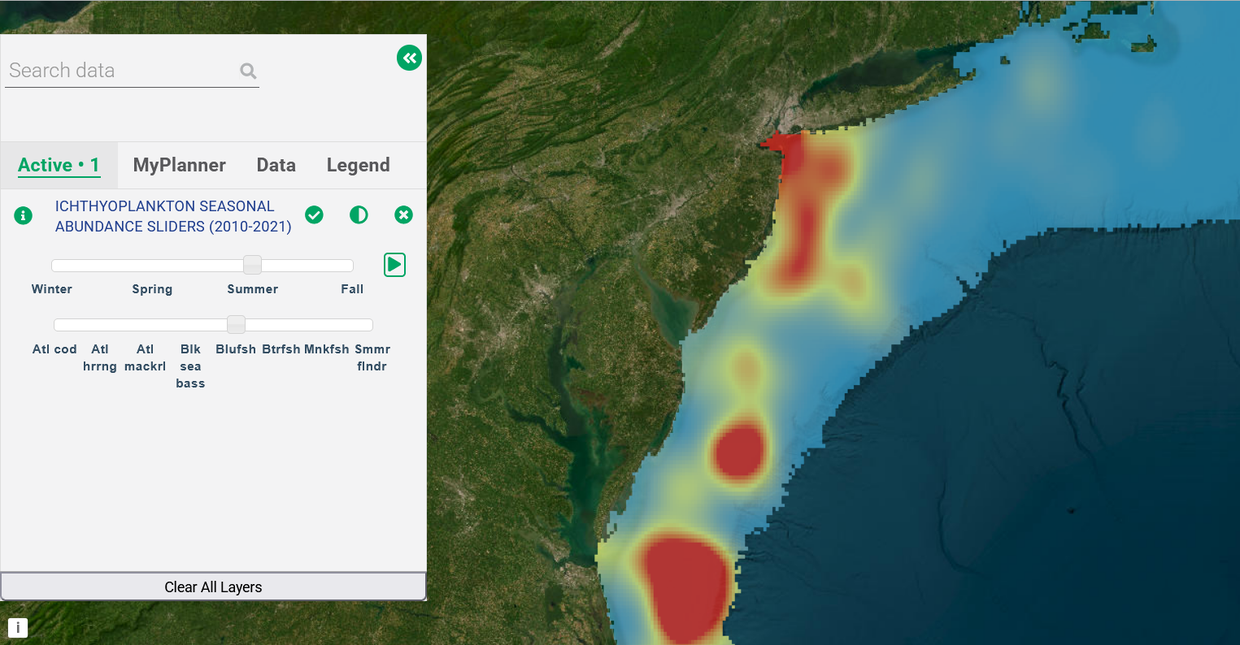
Following the update to the zooplankton data layers, MDAT developed a complementary dataset for ichthyoplankton using the same NOAA Ecosystem Monitoring (EcoMon) survey data. Ichthyoplankton represents the egg and larval stages of fish species. Ichthyoplankton data products can help managers estimate how many fish were in an area to spawn, understand how populations are shifting or changing their habitat due to environment change and other stressors, and characterize the state of marine ecosystems (NOAA Fisheries).
With assistance from the New England Fishery Management Council, MDAT identified eight species for which to develop seasonal ichthyoplankton data products. The data products display abundance for each season for two time periods: 2003-2009 and 2010-2021. These time periods were chosen to align with the zooplankton data products and other MDAT marine-life data products. A companion layer showing EcoMon sampling point locations for each time period and season was also developed to provide context around the variability in sampling effort. For example, sampling effort in winter is lower than other seasons, meaning that the maps were developed by interpolating across greater distances between the sampled points.
With the Ichthyoplankton Seasonal Abundance Sliders (2010-2021) or Ichthyoplankton Seasonal Abundance Sliders (2003-2009) activated, choose the Active tab to automatically animate or manually toggle through seasonal maps for the following eight species:
- Atlantic cod
- Atlantic herring
- Atlantic mackerel
- Black sea bass
- Bluefish
- Butterfish
- Monkfish
- Summer flounder
Citations and More Information
MODIS: NASA Goddard Space Flight Center, Ocean Ecology Laboratory, Ocean Biology Processing Group. Moderate-resolution Imaging Spectroradiometer (MODIS) Aqua Level-2 Ocean Color Data; NASA OB.DAAC, Greenbelt, MD, USA. doi: 10.5067/AQUA/MODIS/L2/OC/2022.0.
VIIRS: Suomi-NPP VIIRS Level-2 Regional Ocean Color (OC) Data, version 2022.0 doi: 10.5067/SUOMI-NPP/VIIRS/L2/OC/2022.0
NOAA-20 VIIRS Level-2 Regional Ocean Color (OC) Data, version 2022.0 doi: 10.5067/NOAA-20/VIIRS/L2/OC/2022.0
OC-CCI: Sathyendranath, S, Brewin, RJW, Brockmann, C, Brotas, V, Calton, B, Chuprin, A, Cipollini, P, Couto, AB, Dingle, J, Doerffer, R, Donlon, C, Dowell, M, Farman, A, Grant, M, Groom, S, Horseman, A, Jackson, T, Krasemann, H, Lavender, S, Martinez-Vicente, V, Mazeran, C, Mélin, F, Moore, TS, Müller, D, Regner, P, Roy, S, Steele, CJ, Steinmetz, F, Swinton, J, Taberner, M, Thompson, A, Valente, A, Zühlke, M, Brando, VE, Feng, H, Feldman, G, Franz, BA, Frouin, R, Gould, Jr., RW, Hooker, SB, Kahru, M, Kratzer, S, Mitchell, BG, Muller-Karger, F, Sosik, HM, Voss, KJ, Werdell, J, and Platt, T (2019) An ocean-colour MDAT Chl-a Concentration v1.0 time series for use in climate studies: the experience of the Ocean-Colour Climate Change Initiative (OC-CCI). Sensors: 19, 4285. doi:10.3390/s19194285
US DOC/NOAA/NMFS > Zooplankton and ichthyoplankton abundance and distribution in the North Atlantic collected by the Ecosystem Monitoring (EcoMon) Project from 1977-02-13 to 2021-11-15 (NCEI Accession 0187513). NOAA National Centers for Environmental Information. Dataset. https://www.ncei.noaa.gov/archive/accession/0187513.